The first map is a Google Earth compatible image of the fishing closure area for the end of May, 2010. This zone delineates the region most notably impacted by the Deep Horizon Well Oil Spill in the Gulf of Mexico.

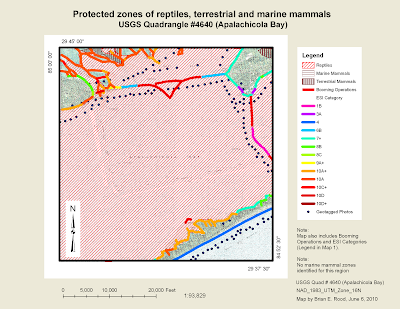
The following three maps identify booming operation and "most sensitive" shoreline zones based on the Environmental Sensitivity Index (ESI).


No comments:
Post a Comment